Voice agents are powerful because they coordinate a lot of moving parts: speech-to-text, turn detection, model inference, text-to-speech, SIP, external tools. That's also what makes them hard to debug. When something feels off, the problem could be in any one of those layers or in the interaction between them.
Developers need to see what happened in the session, not just what the code intended to do. Standard logs don't show audio timing, live participant state, or the exact sequence of events behind an awkward pause or broken tool call.
Agent Console is a realtime debugging surface built to close that gap. It gives you a live view of your voice agent session across audio, events, latency, tool calls, transcripts, session and participant state, RPC traffic, DTMF (dual-tone multi-frequency), and usage so you can inspect the system as it runs instead of reconstructing it from partial evidence after the fact. It also supports video tracks for avatar-based agents.
What you get with Agent Console#
When a voice agent doesn't perform as expected, developers usually need to answer questions like:
- Why is the agent slow on this turn but not the last one?
- Why did it interrupt the user here?
- Why did the tool call block the response?
- Why does this session behave differently over SIP than in a browser?
- Why does my locally running agent behave one way while the deployed version behaves another?
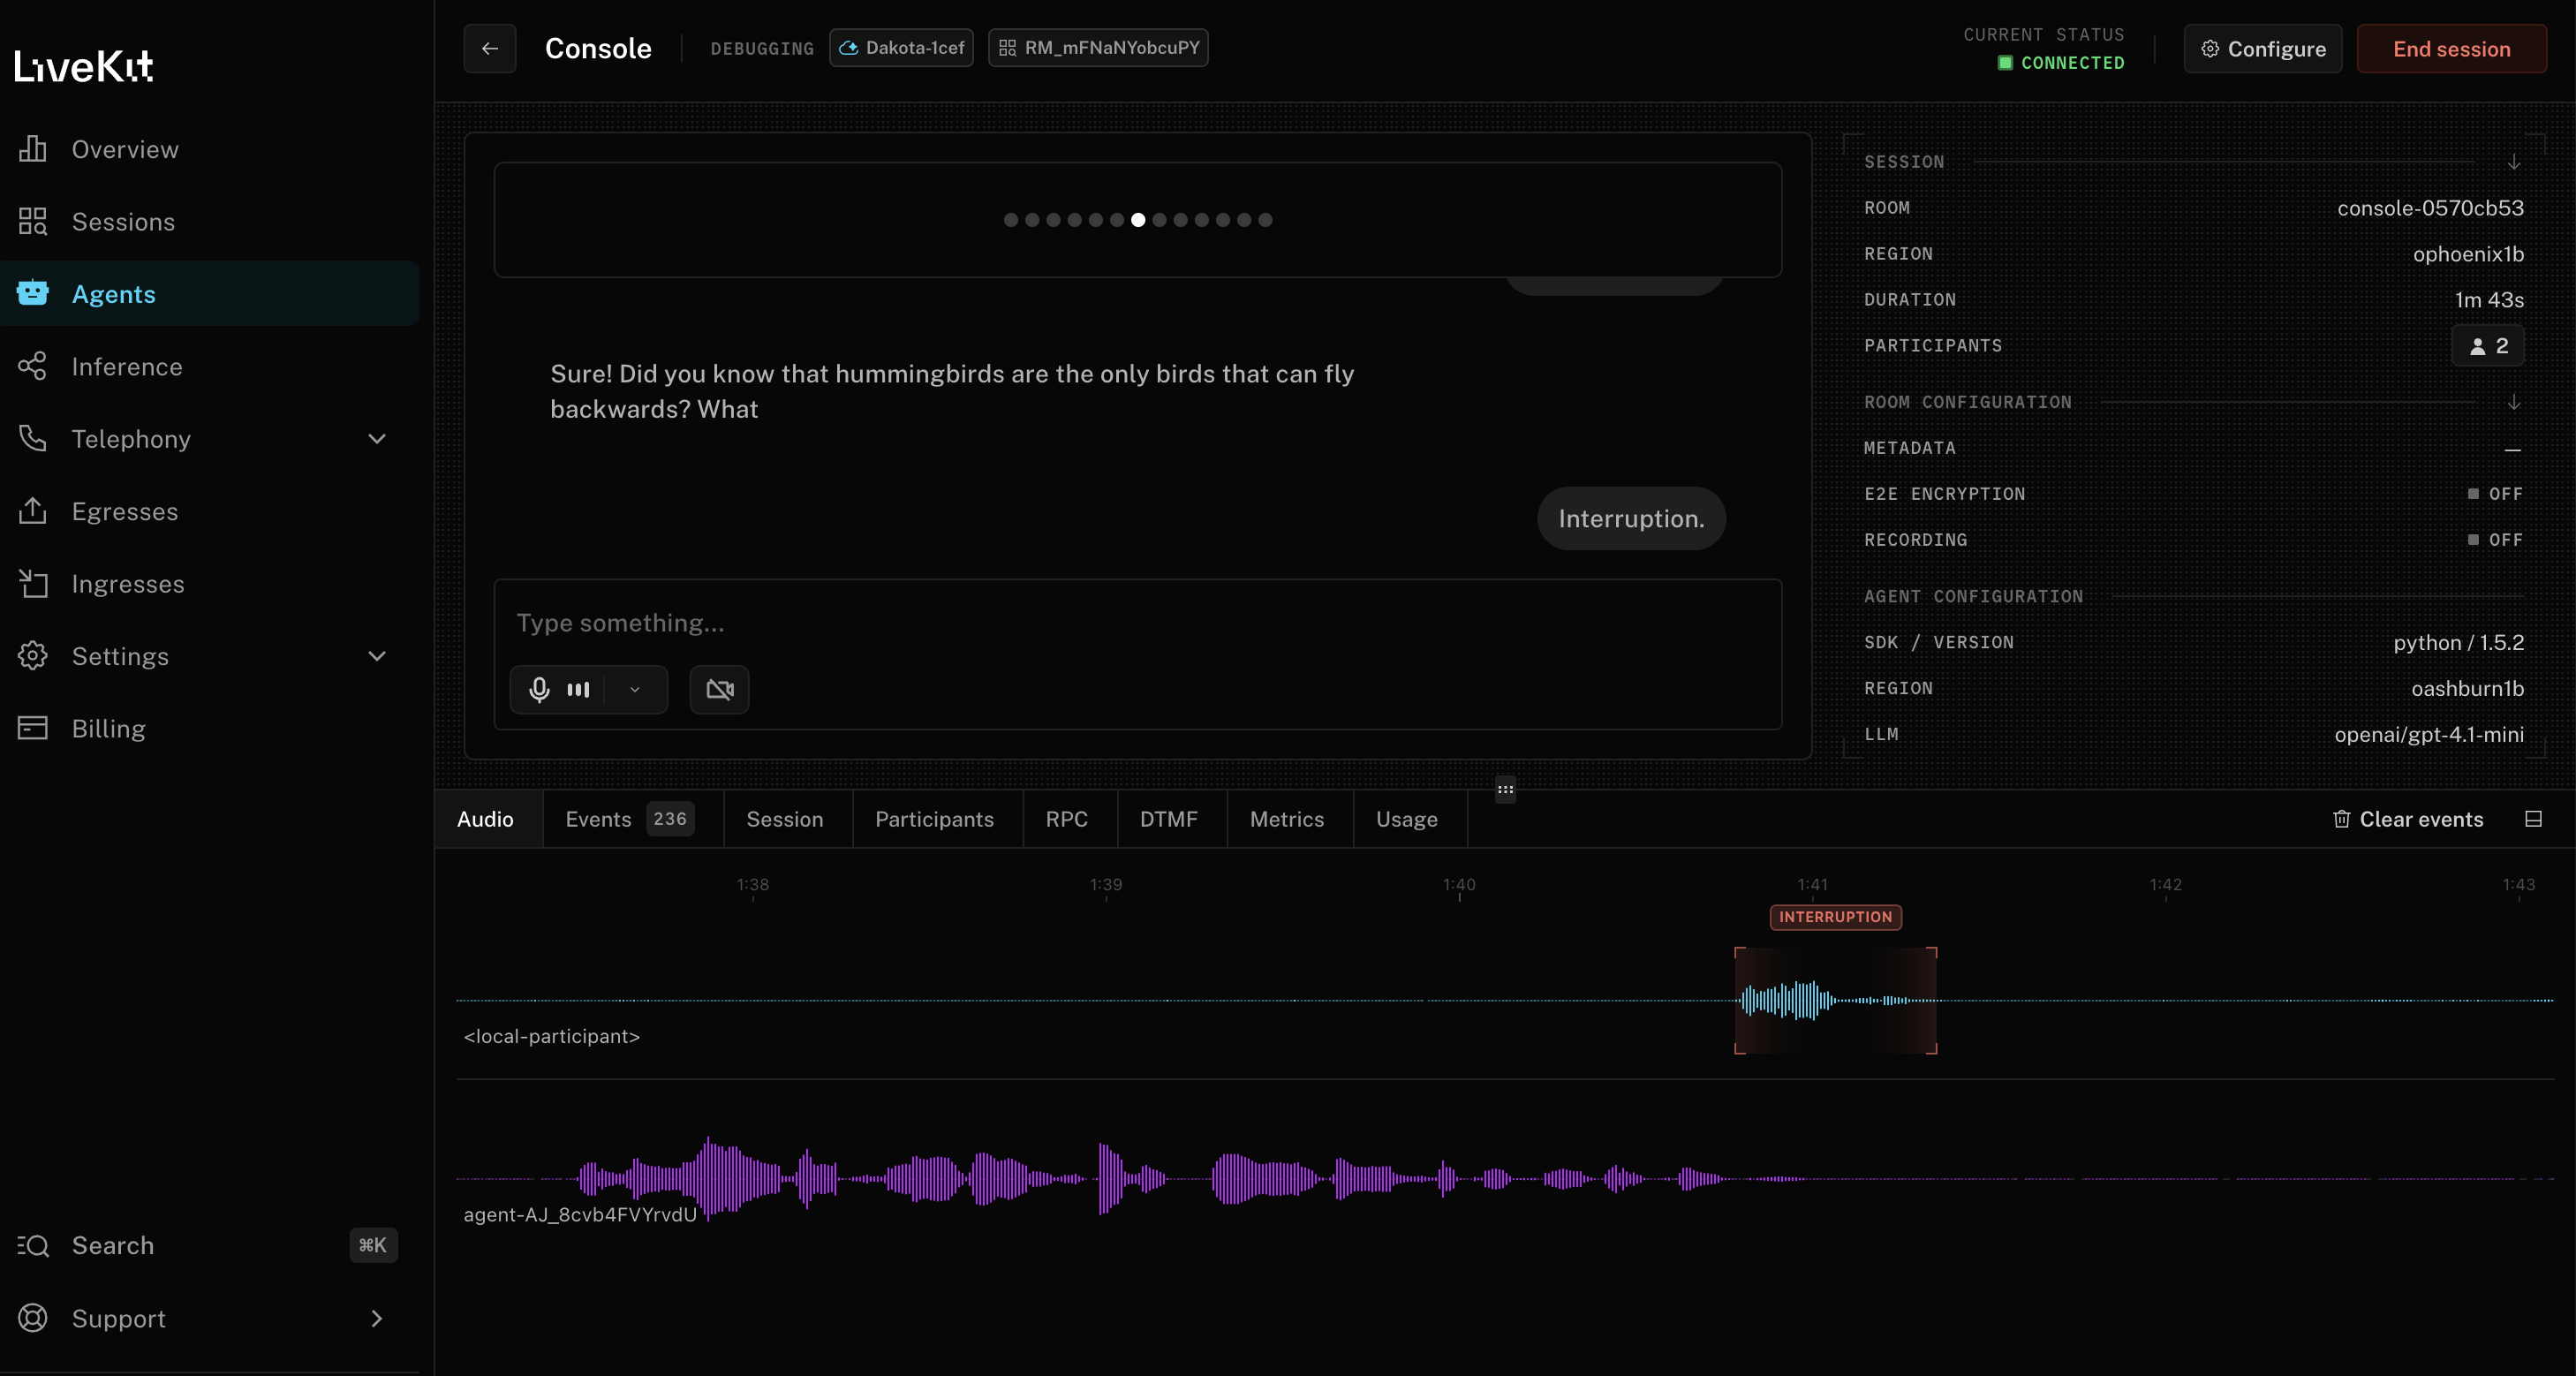
Agent Console is organized around making these questions fast to answer. At the top level, it gives you a live session with your agent and a synchronized view of the signals that matter. You can speak with the agent directly, send text messages, or observe an existing session as a hidden participant.
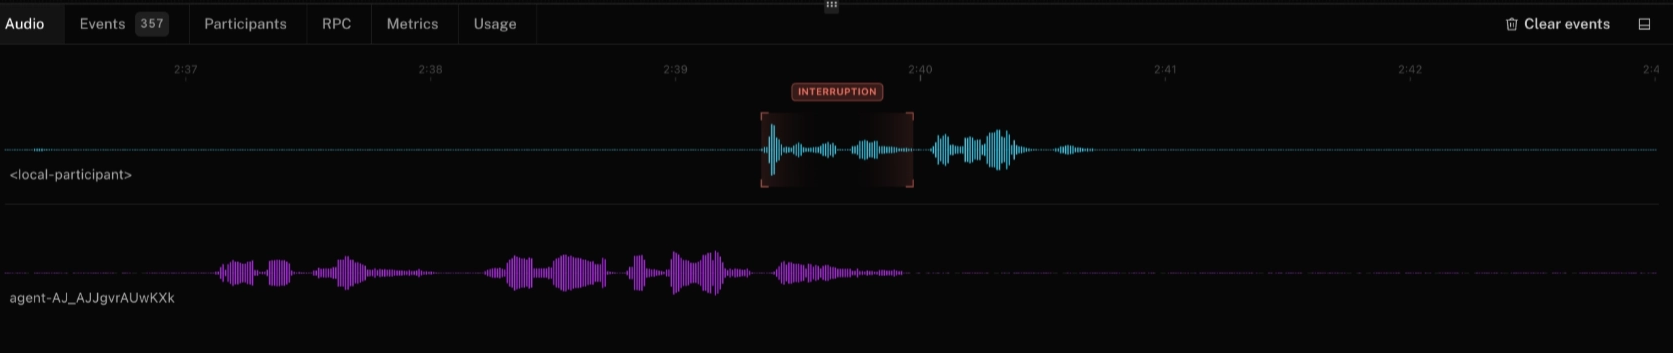
The Audio view shows waveforms for each participant so you can see conversation timing directly: who's speaking, who's listening, and where interruptions or awkward pauses actually happen.
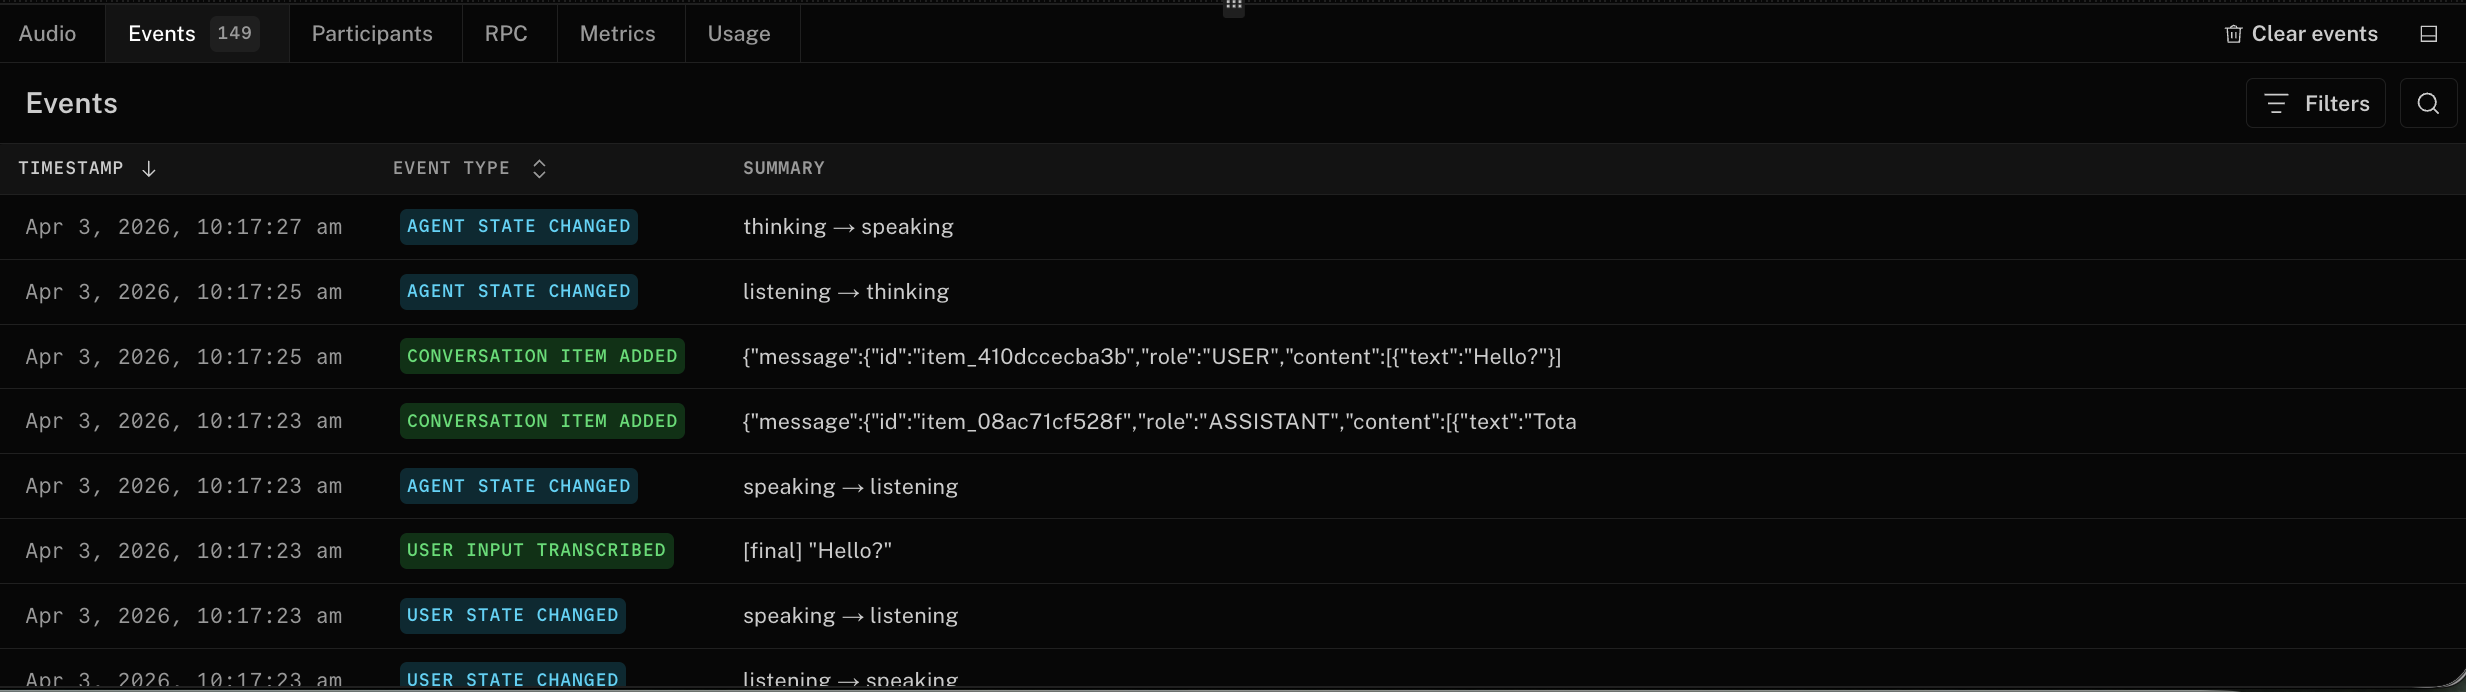
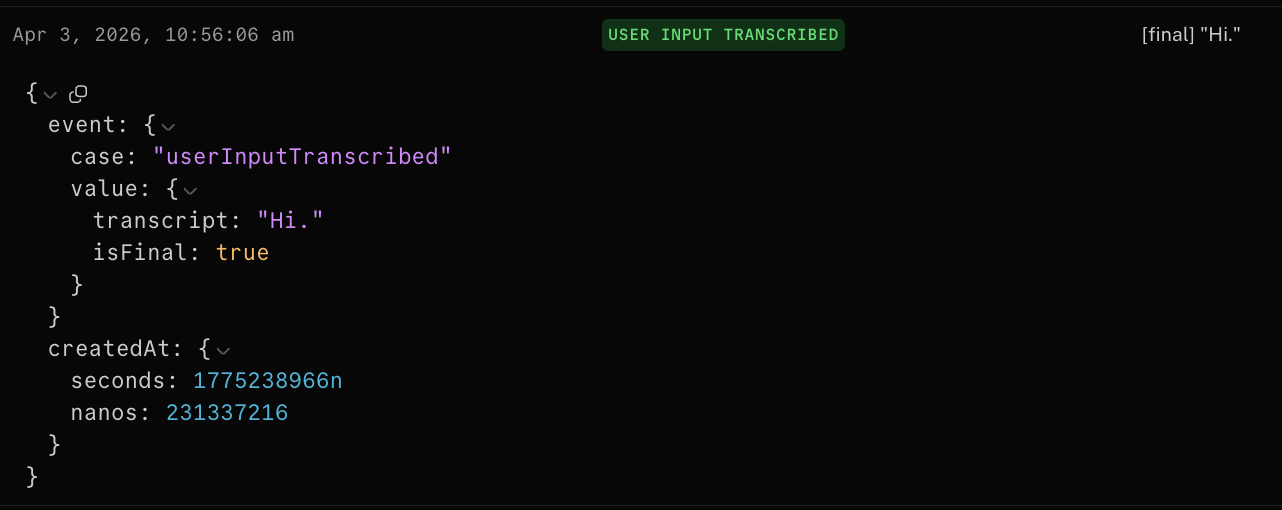
The Events view shows the sequence of state transitions that explain what the agent did in order: participant updates, conversation items, interrupts, tool calls, and other session events as they happen. Instead of piecing behavior together from scattered logs, you see the full event stream in context.
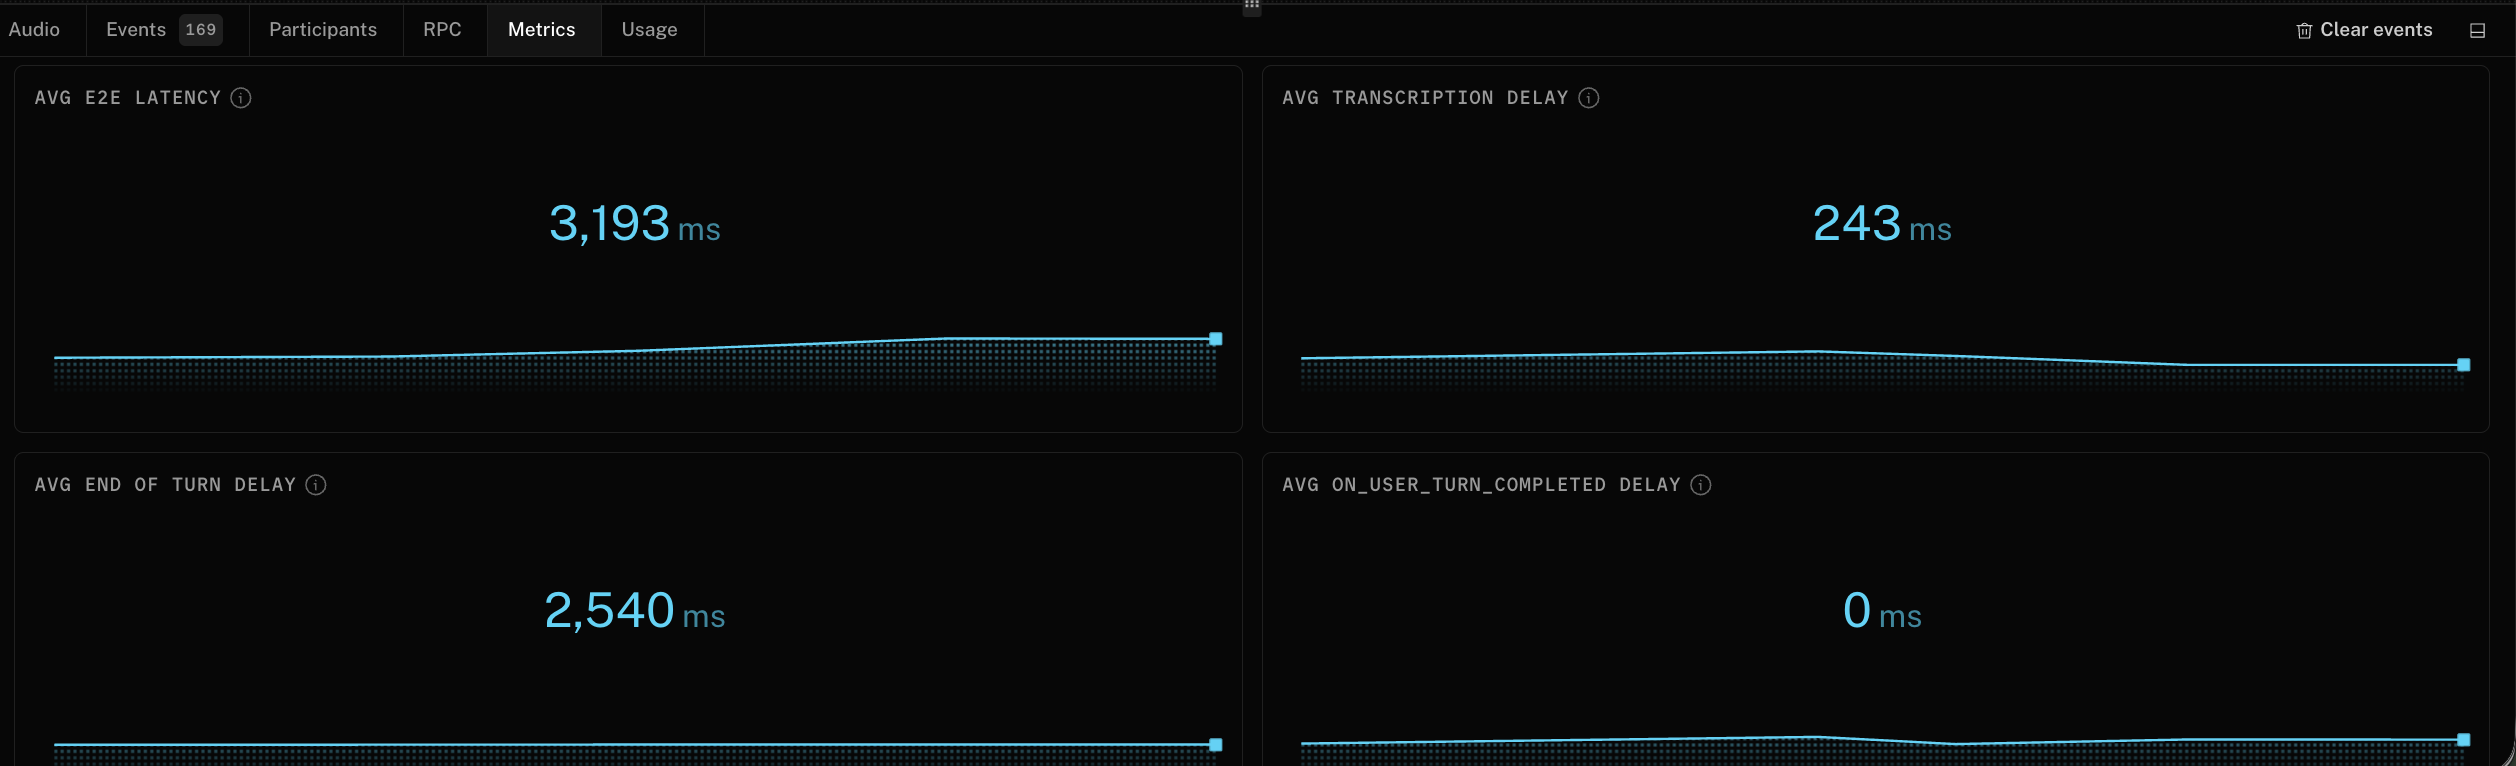
The Metrics view shows the latency profile of the session in real time. If the agent feels slow, you can immediately see whether the bottleneck is LLM time to first token, end-to-end turn latency, endpointing (how the system detects you've stopped speaking), or another pipeline stage.
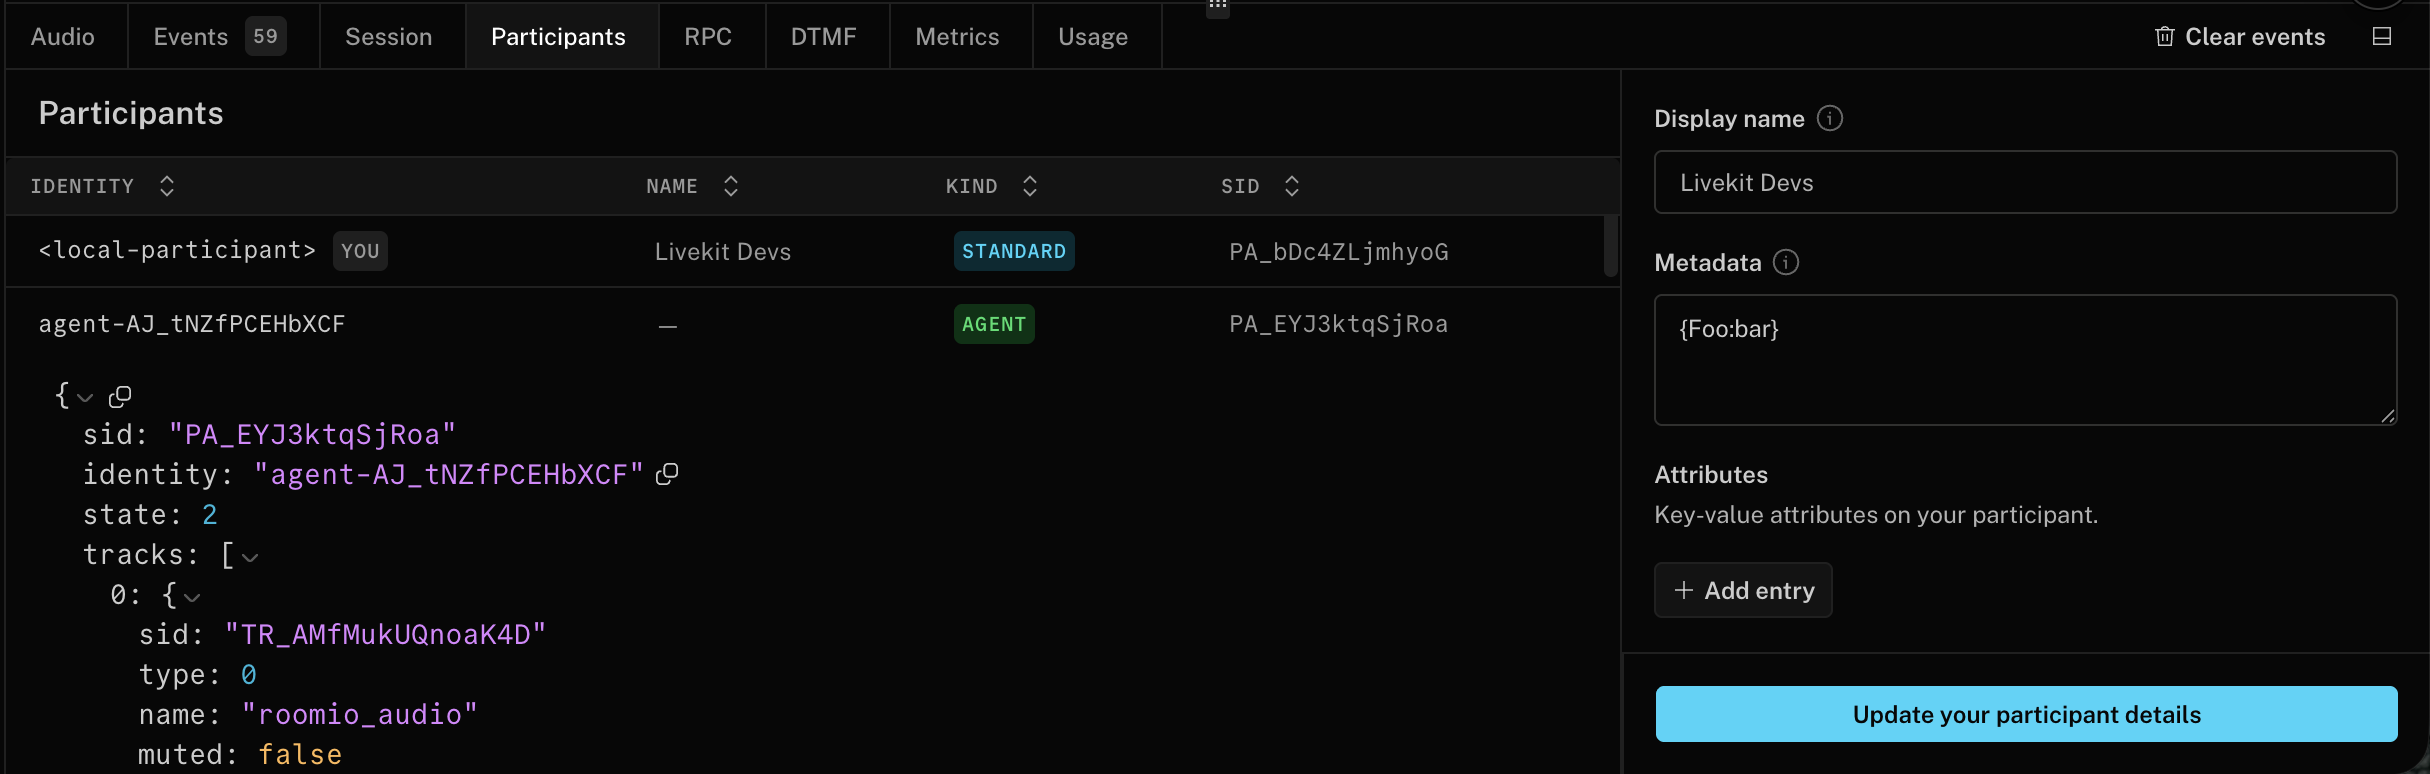
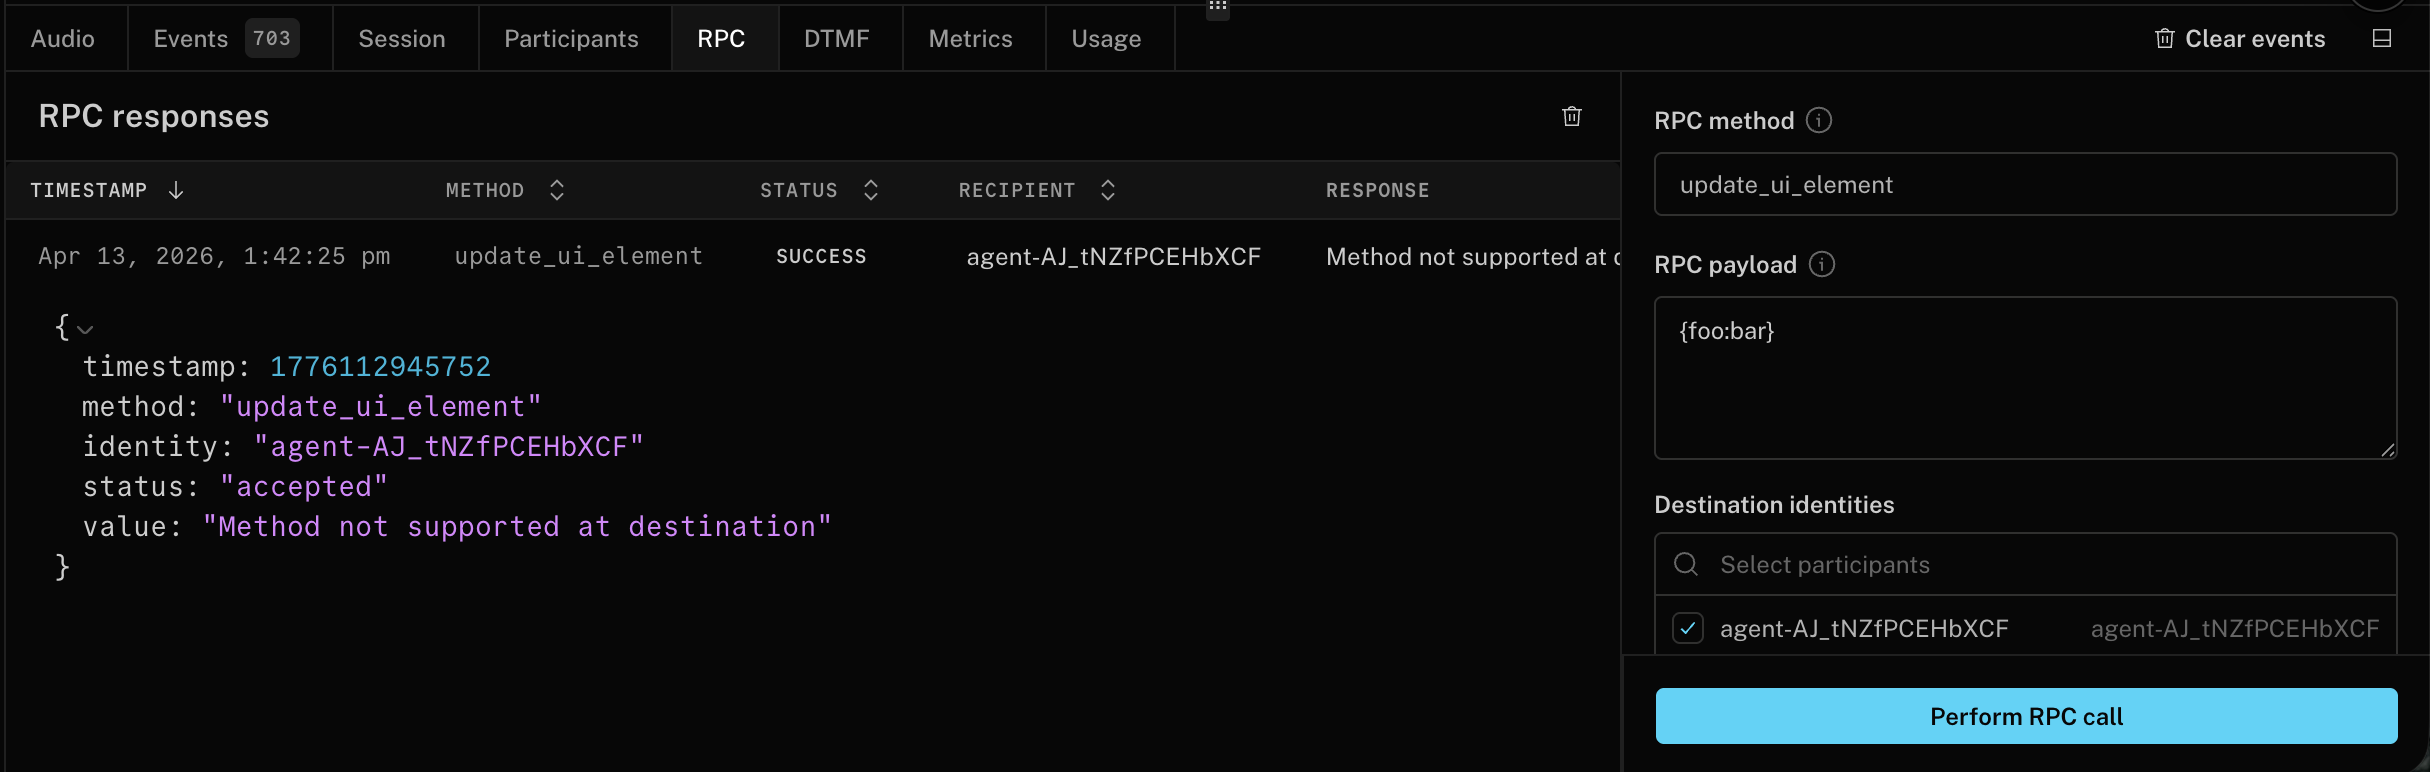
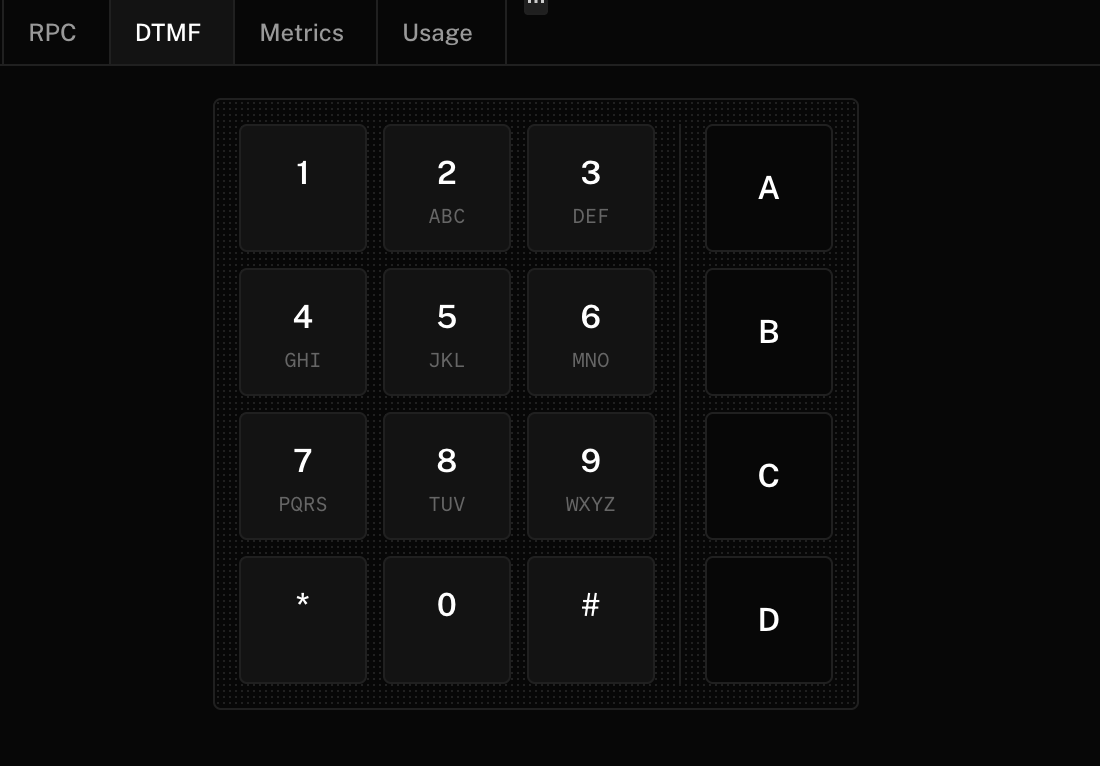
The Participants, RPC, and DTMF views let you inspect participant attributes and metadata, update them live, test RPC flows, and send keypad input for telephony and IVR scenarios, because debugging a real voice agent often means debugging signaling and session context, not just the spoken audio.
The DTMF support also makes Agent Console a practical browser-based way to validate phone trees and keypad-driven flows without leaving the debugging surface.
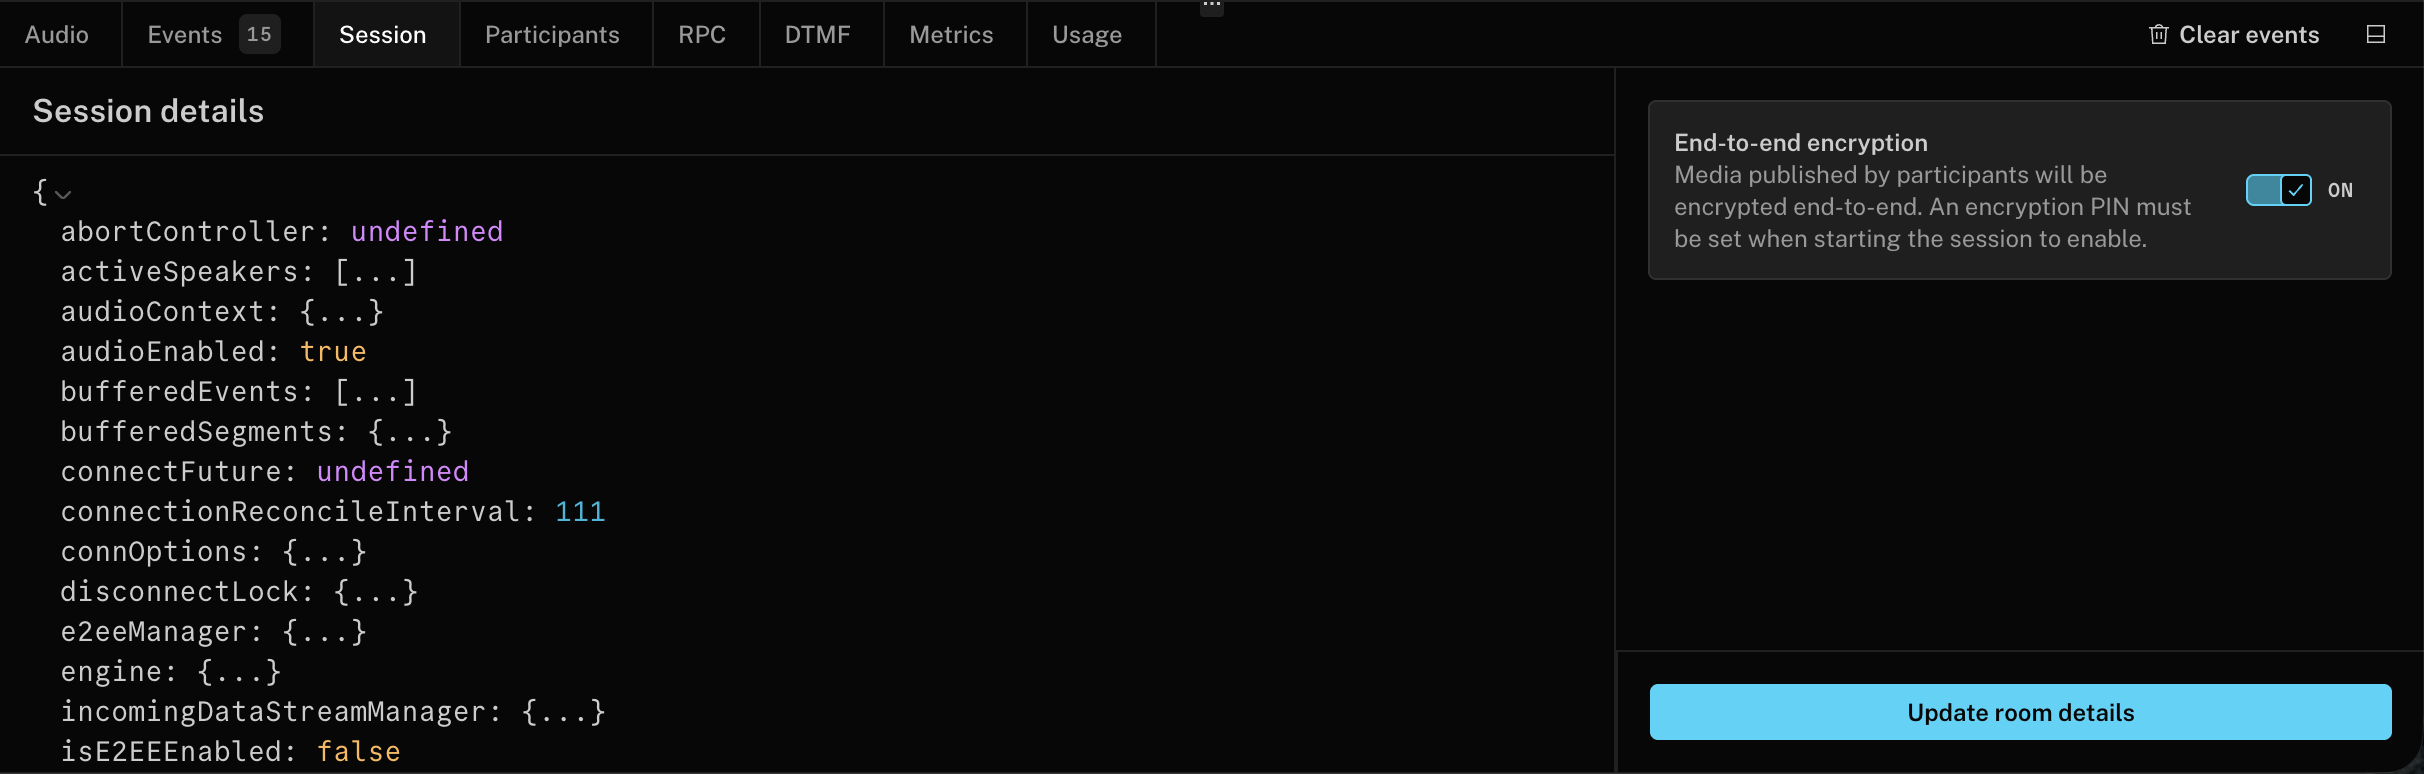
The Session view gives you a raw, live view of the Room object so you can inspect room configuration, current speaker state, server region, negotiated protocols, codecs, and other low-level session details without digging through logs.
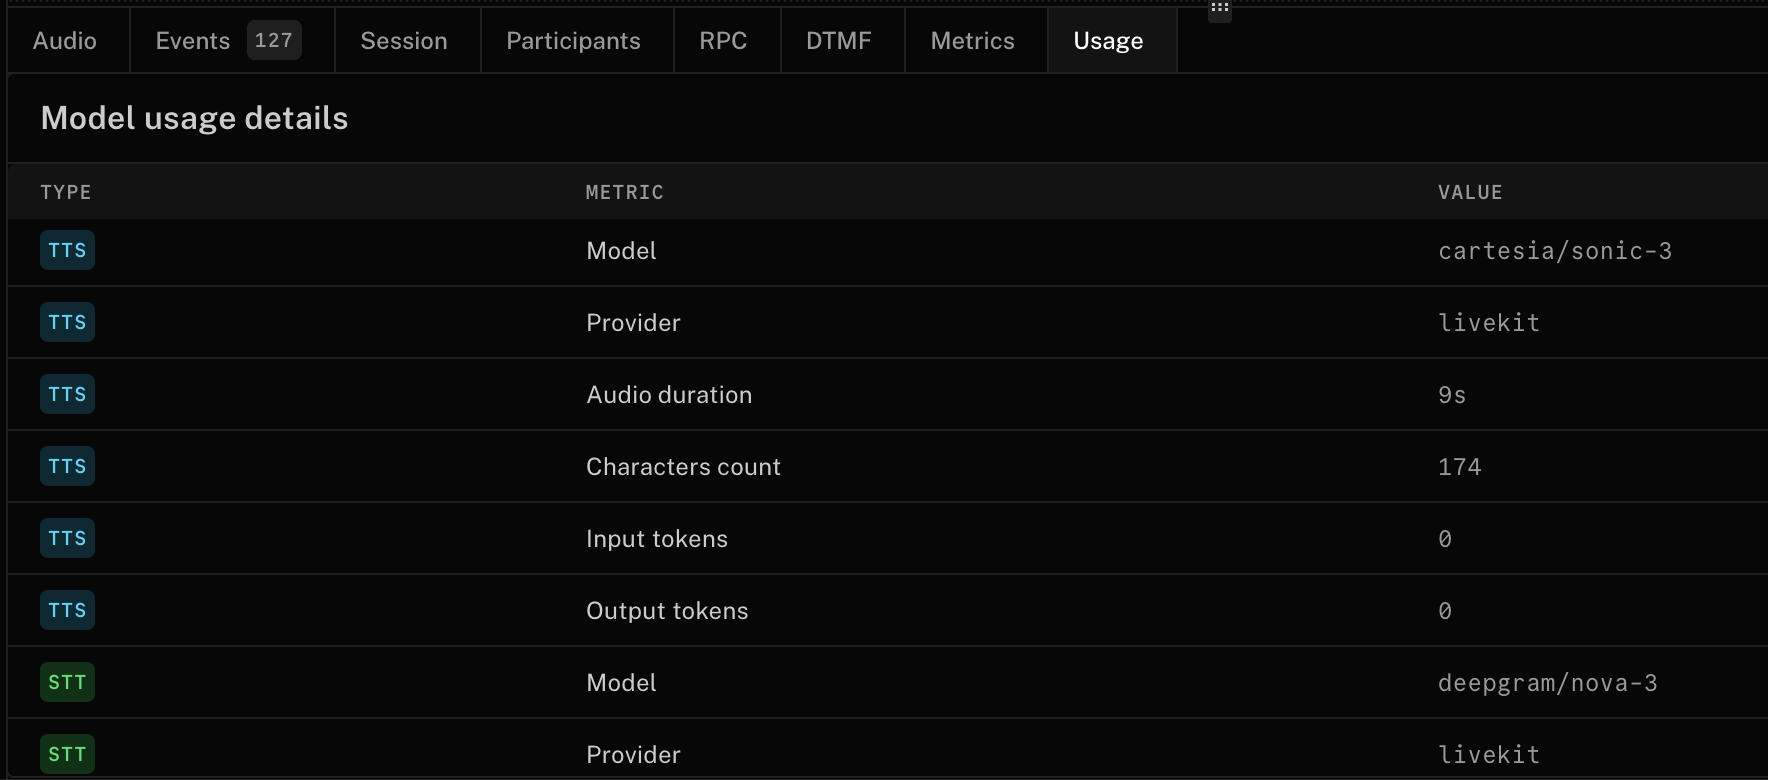
Finally, the Usage view shows what the agent consumed during a session, which matters for both cost tracking and performance analysis, especially when a workflow mixes models or combines conversation with tool execution.
Agent Console also supports video tracks, including avatar agents and local camera devices. If any participant publishes a video track, the console renders it alongside the audio waveform and debugging panels so you can debug avatar-based agents without switching tools.
Built for your development workflow#
Agent Console isn't limited to one development path. It works for:
- Builder agents created using Agent Builder.
- SDK agents written in Python or Node, running locally or deployed on LiveKit Cloud.
- Live sessions you want to observe without joining visibly (hidden participant mode).
You can launch Agent Console from the Agents overview page or within the context of a specific agent in the LiveKit Cloud dashboard.
If you're running an agent locally through the CLI, the same debugging path works. You just need a LiveKit project and a running agent. Start your agent, click the Agent Console link the CLI generates, and you're in.
Most realtime debugging features require Agents SDK 1.5.0 or newer. Builder agents created before the 1.5.0 launch (early April 2026) may need to be redeployed for full support. The browser-based Agent Console is separate from the Python
consolecommand, which is a local terminal testing mode.
Agent Console replaces LiveKit Sandbox as the primary testing surface for deployed agents. Sandbox was useful for quickly talking to an agent, but Agent Console provides the debugging depth that modern voice systems need.
It's also the foundation for a broader debugging and evaluation workflow. Over time, Agent Console will connect more tightly with broader observability workflows, including traces and logs where those features are enabled.
See it in action#
Get started#
Agent Console is available for all users in the LiveKit Cloud dashboard. If you're already building voice agents, it should speed up debugging right away. If you're evaluating platforms, it should clarify what to look for: not just a runtime, but developer tooling that helps you debug voice agents in real time.
Share your feedback or questions in our community forums.