If your LiveKit agent goes silent mid-call, gets killed, ignores interruptions, or drops the call, there's a good chance it's blocking the event loop. This is one of the most common (and most misdiagnosed) causes of agent instability in production.
This guide helps you recognize the symptoms, confirm the cause, and find and fix the blocking code. It's written for developers building on LiveKit Agents in Python and Node.js.
Why blocking the event loop causes problems#
LiveKit Agents runs each job in its own subprocess, and a supervisor process health-checks it with a periodic ping/pong. That health check runs on your agent's event loop, so:
- If the loop is briefly stalled, the health-check response is delayed and you get an "unresponsive" warning.
- If the loop stays blocked long enough, the supervisor concludes the process is dead and kills it. LiveKit detects the disconnect within about 15 seconds and dispatches a fresh agent into the room, as long as the caller is still connected.
The event loop is single-threaded in both Python and Node.js, so any synchronous call that doesn't yield holds up the entire loop until it returns. While it's blocked, no audio is sent or received, the health-check response can't be sent, and interruptions can't be processed.
Common symptoms#
Blocking the event loop produces a varied set of symptoms.
Log signatures
If any of the following appear in your agent logs, it's a strong signal that your code is blocking the loop.
Python:
1WARNING livekit.agents event loop blocked for 288ms at "/app/src/agent.py", line 102, in lookup_order; synchronous work on the agent loop delays audio and turn handling, move it to a thread or an async client2WARNING livekit.agents process is unresponsive delay=12403ERROR livekit.agents process is unresponsive, killing process pid=874WARNING livekit.agents Running <Task ...> took too long: 16.47 seconds
Node.js:
1WARN event loop blocked at lookupOrder (/app/agent.ts:42); synchronous work on the agent loop delays audio and turn handling, move it to a worker thread or an async API2WARN job executor is unresponsive delay=12403WARN job is unresponsive4ERROR job shutdown is taking too much time
The event loop blocked warning comes from the framework's built-in event loop monitor, available in Python livekit-agents 1.8.1+ and Node.js @livekit/agents 1.9.1+. It fires for any stall of 100ms or more and, when a stack sample is available, provides the line of your code that was running.
The delay= value in these warnings is how many milliseconds the loop was stalled. A value in the hundreds or thousands of milliseconds, or one that climbs as call volume rises, means the loop is being starved.
Don't trust the Running <Task …> took too long: X seconds warning to pinpoint the cause. It names whichever task was running when the stall was measured, which is often an internal framework task rather than your blocking code.
You may also see, from the underlying transport layer:
1signal client closed: "ping timeout"
Agent behavior
A blocked event loop shows up differently depending on where in the session's lifecycle it happens.
| During startup | During the call | When shutting down |
|---|---|---|
| The agent is slow to join. There's a long silence before the first audio, and callers sometimes hang up before hearing anything.* | The agent goes silent mid-conversation. It stops responding, then either recovers after a pause or disappears from the room entirely. | Shutdown is unclean. Transcripts go missing, post-call uploads never happen, or sessions don't close properly. |
| The agent joins but takes seconds to publish its audio track. It connects to the room but doesn't bind to the session or start speaking for several seconds.* | The agent is killed and replaced. The process disappears and a fresh instance is spawned to take its place. | Shutdown drags on or times out. Teardown takes longer than the shutdown window allows, so the process is force-killed mid-drain before its cleanup can finish. |
| Interruptions and barge-in are ignored. The caller talks over the agent but nothing happens, and tool calls or transfers don't fire until the participant leaves. | ||
| Turn detection and VAD feel laggy. Turns are detected late or at the wrong moment. A blocked loop can cause this because it can't poll the VAD on schedule.* | ||
| Audio is choppy or stuttering. You hear glitches, or a noticeably delayed start to text-to-speech.* | ||
| The agent feels laggy under load. No single error appears, but many small stalls add up as call volume grows. |
* These behaviors have multiple possible causes; a blocked event loop is only one.
Patterns to avoid#
Prevention beats cure. The following are the most common ways code blocks the loop.
Blocking sleep calls
Make sure no blocking sleep calls are left over from testing. Use the async equivalents:
1# Python2await asyncio.sleep(2)
Node.js: use await new Promise(r => setTimeout(r, 2000))
Synchronous HTTP calls
Libraries like requests, urllib, and most non-async SDK clients block until the response returns. Prefer async HTTP and the shared, job-scoped session:
1# BAD:2import requests3resp = requests.get(url) # blocks the loop for the entire round-trip45# GOOD: use async HTTP and the shared, job-scoped session6from livekit.agents import utils7session = utils.http_context.http_session()8async with session.get(url) as resp:9data = await resp.json()
Node.js: use fetch/undici or an async client, not synchronous request libraries.
Synchronous database drivers and RAG lookups
A blocking DB query or a synchronous RAG lookup on the loop stalls everything. Use an async driver or offload the blocking call. Watch out for synchronous auth/token flows too, where some cloud SDK credential fetches block while acquiring a token.
CPU-bound work on the loop
Watch for heavy computation that runs on the loop, such as:
- Audio DSP, noise suppression, resampling, format/color conversion
- Embeddings, tokenization, local model inference
- Cryptography, large JSON/regex parsing, image/video frame processing
1# BAD: heavy compute inline2result = expensive_numpy_transform(frame)34# GOOD: offload to a thread5result = await asyncio.to_thread(expensive_numpy_transform, frame)
This example works because numpy's vectorized operations release the GIL during heavy C computation, freeing the loop. Pure-Python CPU work doesn't release the GIL, so a separate thread will still block the loop. Use a separate process (or a native/async library) for genuinely heavy compute. In Node.js, move CPU-bound work to a worker_thread.
Native C extensions that block
Some libraries look like normal async SDK calls but drop into a synchronous C extension under the hood (audio enhancement models and certain streaming STT clients are common offenders). If you find one, isolate it in a thread or process, or switch to a pure-async implementation.
Blocking work in the entrypoint before the agent is listening
Slow work in the entrypoint delays the agent from joining and publishing its first audio.
1@server.rtc_session()2async def entrypoint(ctx: JobContext):3# BAD: a synchronous fetch blocks the loop and delays the whole session4user = fetch_user_profile_sync(...)5await ctx.connect()
Best practice:
- Pass user/session data via job metadata, room metadata, or participant attributes instead of fetching in the entrypoint.
- If you must make a network call in the entrypoint, do it before
ctx.connect()and make it async, so the frontend doesn't show the agent before it's actually listening.
Re-initializing expensive resources on every job
Because a new process (and event loop) is created per job, anything you build in the entrypoint is rebuilt on every call: loading models, opening DB pools, building clients, validating config.
The prewarm function runs once when a worker process starts, before it picks up any job. Load a resource there and stash it on proc.userdata, and every job that worker handles can reuse it instead of rebuilding it. Here, a set of company FAQs is read from disk once and reused by every session that process handles:
1# GOOD: load the reference data once at worker startup2server = AgentServer()34def prewarm(proc: JobProcess):5with open("company_faqs.json") as f:6proc.userdata["faqs"] = json.load(f)78server.setup_fnc = prewarm910# then reuse it in the entrypoint via ctx.proc.userdata["faqs"]
Note that an async client (e.g. an async Redis or DB client) created at import time or in prewarm is bound to a different event loop than the per-job loop and will fail when used. Create such clients inside the entrypoint/session, or lazily on first use within the job's loop.
Blocking or unbounded work in shutdown callbacks
If post-call work in a shutdown callback (transcript uploads, DB writes, API calls) exceeds the shutdown timeout, the process is force-killed and you lose that work.
1# GOOD: bound the work so it can't hang the shutdown2async def on_shutdown():3await asyncio.wait_for(4asyncio.to_thread(upload_transcript, session_history),5timeout=10.0,6)78ctx.add_shutdown_callback(on_shutdown)
If your shutdown work is legitimately long, raise shutdown_process_timeout on your AgentServer, but still bound each step with asyncio.wait_for so a hang can't block drain forever.
Slow tool calls with no feedback
Tool calls and MCP servers are often not built for realtime and can take a long time to respond. For how to keep the agent talking while a slow tool runs, see Async tools for voice agents.
Blocking inside callbacks and pipeline hooks
Event handlers (@room.on(...), @session.on(...)), the on_user_turn_completed hook, and pipeline nodes (STT/LLM/TTS) all run on the loop, so keep them non-blocking.
Blocking imports and module-level work
Heavy top-level imports or model initialization at import time delay worker startup and registration. Keep module load light; defer heavy initialization to prewarm.
If the immediate cause isn't obvious#
If your agent is showing signs of a blocked loop, the following techniques can help you pin down the root cause.
Check the built-in event loop monitor
LiveKit Agents watches its own event loop and reports every stall of 100ms or more, with no code changes needed. It's on by default in Python livekit-agents 1.8.1+ and Node.js @livekit/agents 1.9.1+. A blocking call like this one:
1@function_tool2async def lookup_order(self, order_id: str):3time.sleep(0.3) # blocks the event loop4...
produces the following:
-
A warning log naming the innermost line of your code that was running, as described earlier:
event loop blocked for 288ms at "/app/src/agent.py", line 102, in lookup_order.... -
An
event_loop_blockedspan in your agent's trace.
In Agent Observability, the stall appears inside the tool call that caused it:

Note that nesting the stall under the operation that caused it requires Python 3.12 or later. On earlier versions, event_loop_blocked spans appear directly under agent_session instead.
Select the span to see its attributes, including duration and where the stall happened:
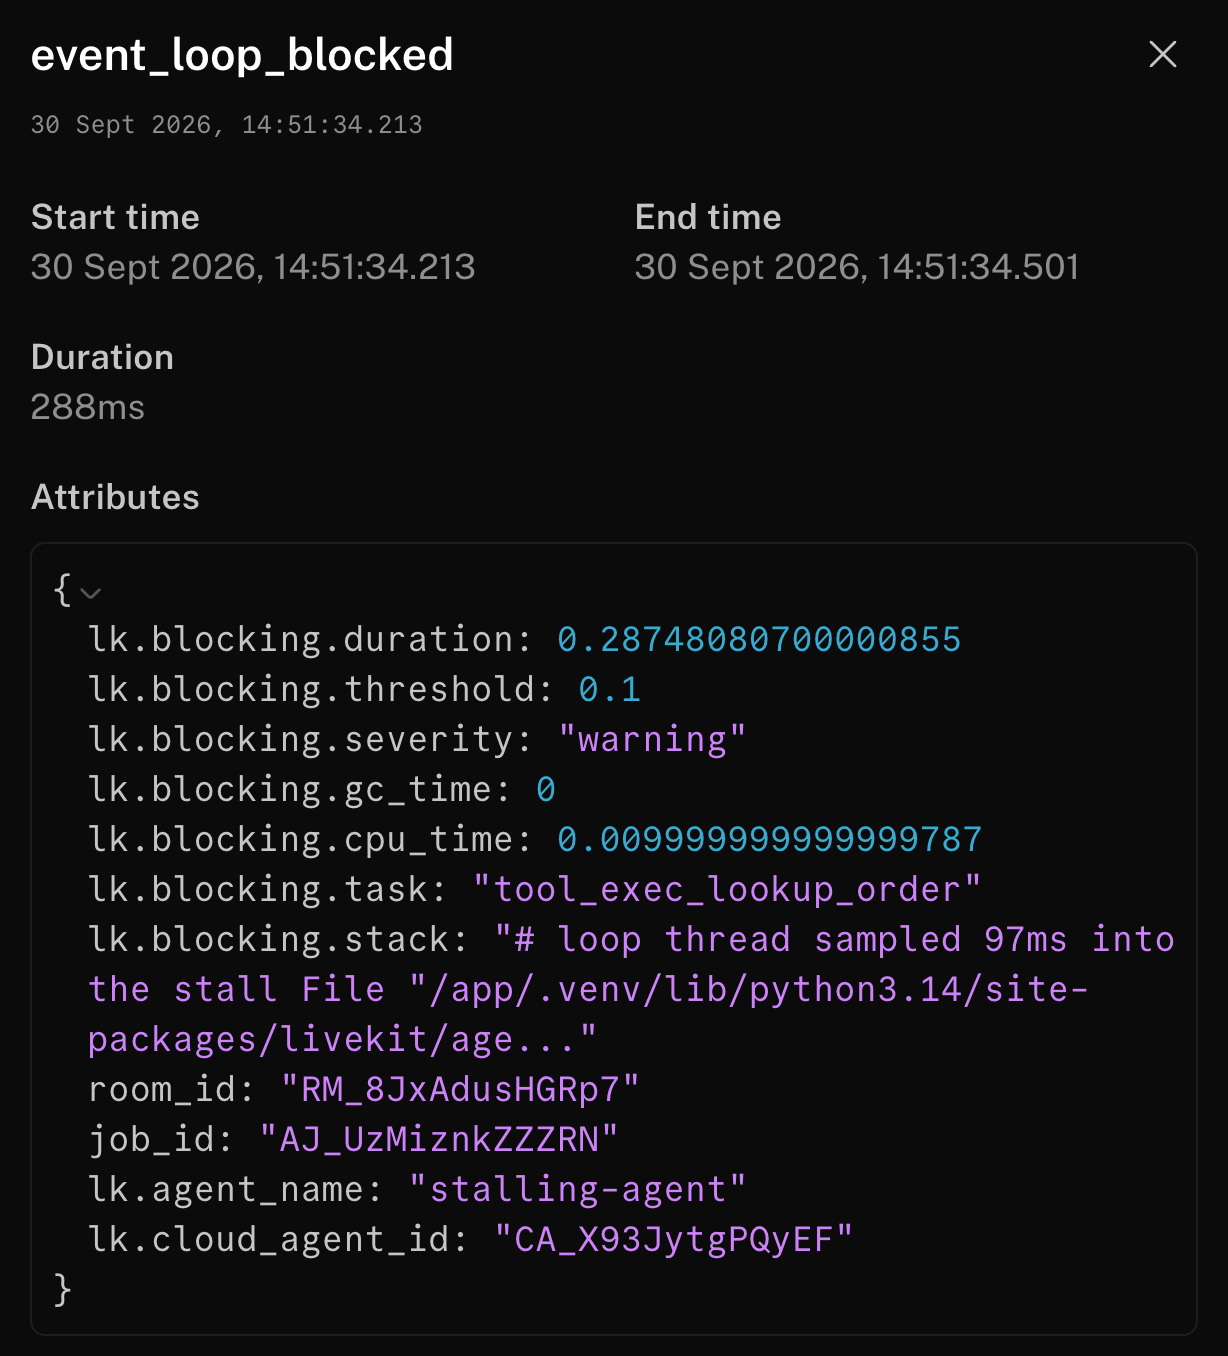
The stall lasted 288ms but only used 10ms of CPU time, so the loop was waiting, which is the behavior you would expect from a time.sleep.
For specific details on how the monitor works, see the Python and Node.js PRs.
Use py-spy on a running process (Python)
py-spy attaches to a live process without modifying it, and can inspect C extensions that are invisible to Python-frame profilers.
1py-spy dump --pid <agent_pid> # snapshot the current stack of a hung process2py-spy record -o profile.svg --pid <agent_pid> # flame graph for intermittent stalls
If the stack repeatedly lands in the same synchronous call, that's your block.
Enable asyncio debug mode (Python)
1PYTHONASYNCIODEBUG=1 python my_agent.py
Or in code, loop.set_debug(True) and tune loop.slow_callback_duration. This surfaces slow callbacks and the coroutines responsible.
Measure event-loop lag in Node.js
Node.js has good built-in tools for measuring event-loop lag:
1import { monitorEventLoopDelay } from 'node:perf_hooks';2const h = monitorEventLoopDelay();3h.enable();4// ... later ...5console.log('event loop p99 delay (ms):', h.percentile(99) / 1e6);
Also useful: node --cpu-prof / --prof (V8 profiler) and node --inspect with Chrome DevTools.
In summary#
- During development, code defensively and avoid synchronous calls where possible.
- Learn the symptoms of a blocked loop and how your agent misbehaves when it happens.
- Watch for
event loop blockedwarnings andevent_loop_blockedspans. - Many symptoms that suggest a blocked loop have several possible causes, so keep an open mind and consult your agent logs when debugging.